Ask the sales data a better question.
A tiny dimensional model makes it possible to compare revenue by month, region, category, and product—with the same fact table underneath.
All values are synthetic and illustrative. The query results are computed with DuckDB during the automated build.
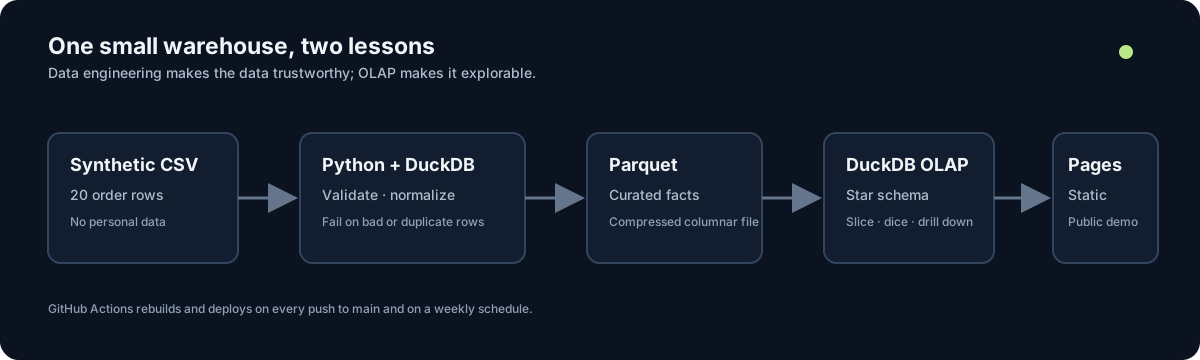
Warehouse snapshot
—orders
—total sales value
—average order value
—fact rows
Revenue by month
Revenue by region
Drill down: month → region → product
The detailed result below is the next grain down. Start from a monthly total, choose a region, then inspect category and product contribution.
| Month | Region | Category | Product | Units | Revenue |
|---|