Data Engineering
Python and DuckDB load a CSV, validate required fields and unique order IDs, normalize the data, and publish Parquet.
Read the pipeline report →Two compact demonstrations: a data pipeline that rejects bad input, and an OLAP model that turns clean transactions into analytical questions.
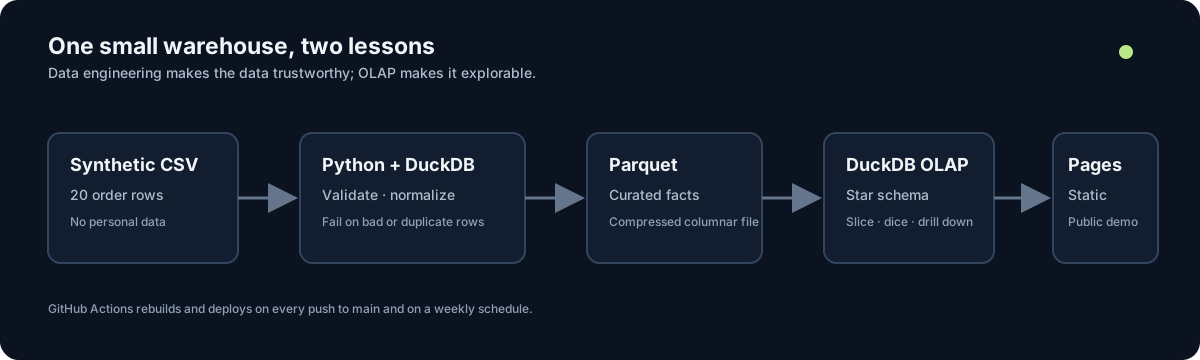
Can this data be trusted before it reaches analytics? Then, can we summarize it by time, region, category, and product without changing the source records? The examples use synthetic sales rows only.
Python and DuckDB load a CSV, validate required fields and unique order IDs, normalize the data, and publish Parquet.
Read the pipeline report →DuckDB builds a small star schema and computes totals that support slice, dice, and drill-down analysis.
Open the OLAP report →A GitHub Actions workflow runs tests, rebuilds both reports, and deploys the static site to GitHub Pages on pushes to main. It also runs weekly. The queries are executed during the build; the website serves static results, not a live database.